California Management Review
California Management Review is a premier academic management journal published at UC Berkeley
by Daniel J. Finkenstadt, Rob Handfield, and Peter Guinto

Image Credit | Alina Grubnyak
Medical sourcing has exposed significant weaknesses in our national security, especially as it relates to supply chain management. From COVID-19 to Monkeypox the lack of supply chain traceability, flexibility, global independence, and responsiveness have caused massive inefficiencies and performance issues across public and private sourcing for vital items such as PPE and vaccines since the pandemic hit US soil at the start of 2020.1 Data is a primary observation for any planning activity but can become a ‘holy grail’ of sorts in a contingency environment. We observed two major data management conundrums during the federal pandemic response that fundamentally altered our perception of supply chain risk management: Issue 1 – Too many competing goals, with not enough discernable data to meet them; Issue 2 – Too much data and not enough direction to leverage it. These issues don’t just crop up during global contingencies like a pandemic, they exist in most public and private organizations, especially in our age of what Spivey coined as “Data Saturation” and Debra Bass has named “InfoObesity”.
“Digital Data Streams: Creating Value from the Real-Time Flow of Big Data” by Federico Pigni, Gabriele Piccoli, & Richard Watson. (Vol. 58/3) 2016.
“How to Use Big Data to Drive Your Supply Chain” By Nada R. Sanders. (Vol. 58/3) 2016.
The first type of data management issue we observed during the pandemic involved the overabundance of competing goals. Some agencies were primarily focused on increasing the supply of ventilators, while others were focused on increasing the fidelity of epi models for predicting the virus’ spread. Hospitals were competing for resources such as personal protective gear and medical staff without a shared understanding of the national need. There was no centralized mechanism to aggregate disparate hospital need data in order to prioritize and allocate resources efficiently and equitably, resulting in the haves and the have nots during a major medical crisis. Many response priorities were being driven by the news media, and not by actual need. In fact, our research suggested that most hospitals either did not have the data within their systems or avoided sharing it with others when they did have it. A review of hospital shortage data developed by the CDC’s National Healthcare Safety Network (NHSN) also shows that government data was misrepresented.
At the same time, we faced this dearth of centralized data goals we also faced an explosion of disparate data related to virus spread, market intelligence on vendors claiming to provide product X of service Y for federal agency spreadsheets on stated need for medical equipment and PPE. The result - chaos. For example, state chief purchasing officers (CPOs) were inundated by sales pitches for PPE from multiple distributors, many of which were not vetted or who did not even have PPE in their warehouses. This led to several instances of fraud, which were investigated in detail by the FBI. Similarly, many organizations are overwhelmed by purchasing transaction data, which often leads them unable to discern potentially fraudulent activities that may be occurring, such as multiple vendors with the same address, or having the same business owner, or over-charging over contracted prices previously negotiated.
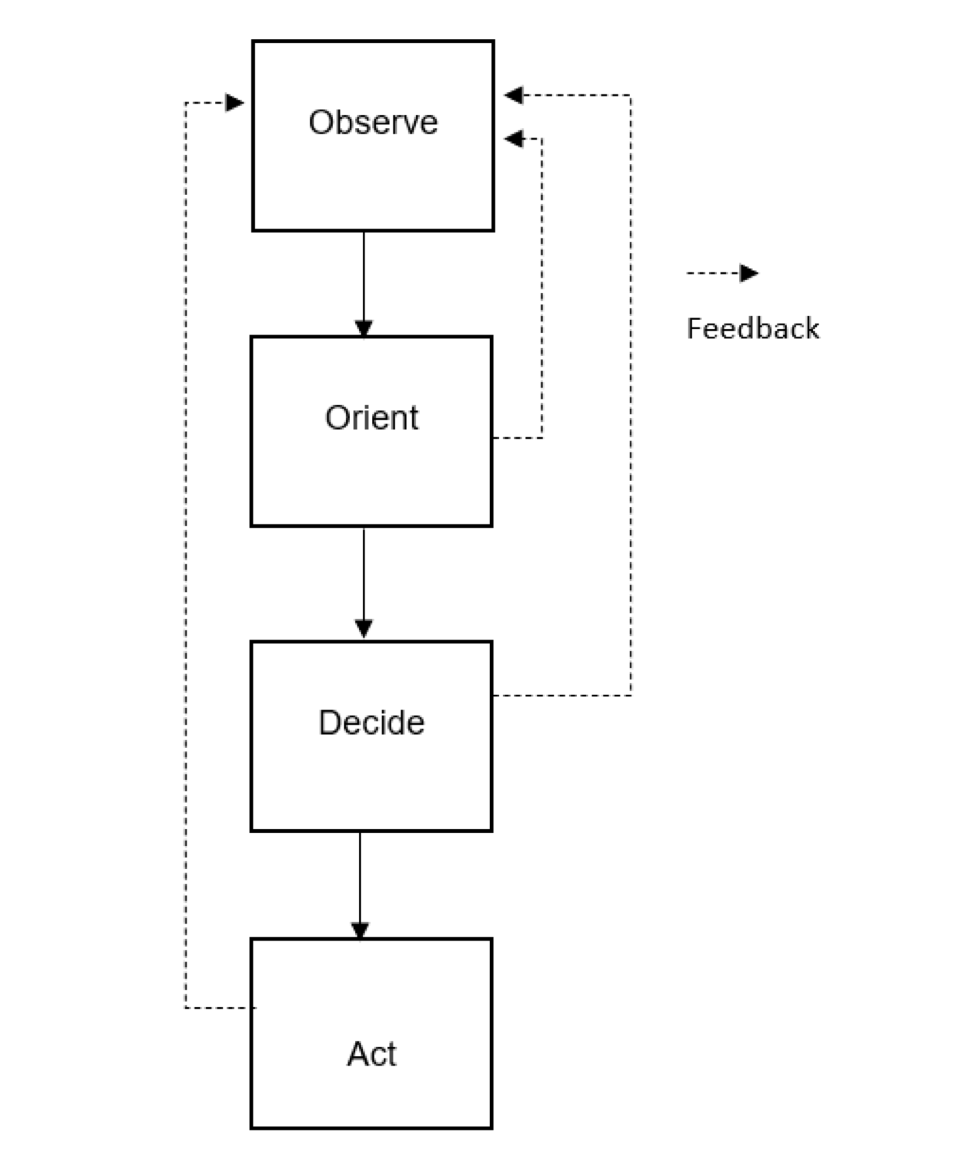
Prior to the age of data saturation, we could rely on traditional management decision models such as Boyd’s OODA Loop.

Boyd's OODA Loop
The late Air Force Colonel John Boyd tells us, observation is the first step to adapting and responding to the unexpected, followed by orientation, decisions, and actions (the OODA loop).2 This model is taught in federal personnel development courses such as professional military education and many of the government’s leaders, including the authors, have managed their decisions according to this model. The weakness in the OODA loop in a data saturated world is that it tends to focus users on the observation first…i.e., data, vs. the outcome goal, or intended effect. This can be overwhelming in a world of endless volumes of data, leading to decision swirl. We admire the data instead of strategically leveraging it. It may seem counterintuitive to first ignore the data in a world of endless data, but that is precisely the point, data saturation has occurred because our ability to collect data has outpaced our ability to support, filter and manage it.3 Trying to do this during an emergency event with full force fog-of-war underway is exponentially worse. Responders need to re-center planning and response management processes to focus on outcomes as the step 1 of the process and employ data as a resource to strategically tap into with intent to cause kinetic effects.
Dexterity and sophistication in employing data are critical organizational capabilities, along with its cultural embrace of digital capabilities. The authors of the book FLOW: How the Best Supply Chains Thrive,4 demonstrate that data in and of itself is not a definitive advantage. Data is, of course, everywhere; most organizations are overwhelmed by it. The key to predicting flows is not data, but knowledge. Specifically, it is the ability and action of the human-machine interaction to drive changes in a system’s design and flows.5 Information is not knowledge, and data residing in an organization is not knowledge either. Data is interpreted in a manner that allows prediction, which occurs through individuals, who must act on data to render it useful. With this in mind, we can begin to understand how the so-called digital transformation of organizations occurs not through its data and information technologies, but in the relative level of digital dexterity for individuals in that organization.
We are in the very early stages of using data for real-time decision-making, largely because many companies struggle with data quality. It is also very difficult to connect groups across organizations digitally. What is needed is a cultural shift, whereby people in different organizations responding to something like a pandemic are willing to lose control of their data by allowing it to be shared with other entities. However, despite that data sharing is critical, there are always a lot of constraints, and sometimes data sharing is not allowed. In some industries, such as financial services and healthcare, it is prohibited by the regulators. There are some security concerns about data sharing as well, but the cloud providers are developing some interesting opportunities there. Also, distributed ledgers (i.e., blockchains) can be used to exchange data securely.
Our team of experts working with the federal response to COVID-19 supply chain issues found that data was the largest hurdle in terms of observation and orientation. This, in turn, impacted state, local and federal agencies, firms and non-profit’s ability to decide and act in an efficient, interoperable, and strategic manner. Availability of data, data sharing across institutional stovepipes and the ability to synthesize and interpret data intelligently were all woefully lacking. They still are. The common thread in all this data failure was a lack of corporate strategy at every level. This is not necessarily organizational negligence, more of a new paradigm that has been on the horizon for years but has had limited understanding in terms of how to shift towards it. There are very few strategies on how data will be gathered, what will be gathered, how it will be visualized for decision-making and what types of decisions are even necessary. We see an immediate need to develop a strategy methodology for value chain data that leverages the benefits of value stream mapping adapted for this particular purpose.
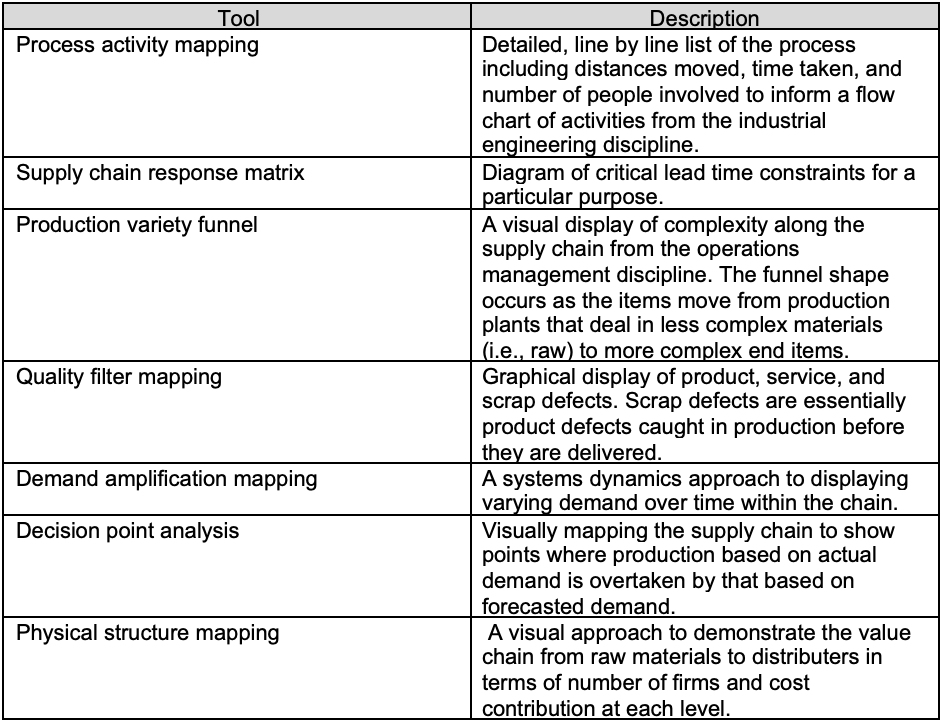
The concept of value chains and value stream mapping are not new. Michael Porter introduced value chains in 1985.6 Value chains expand the traditional supply chain to include both primary activities of inbound logistics, operations, outbound logistics, marketing and sales, and service as well as secondary activities such as procurement, human resources management, technology development and infrastructure (Figure 1). Value stream mapping was introduced by Toyota’s Taiichi Ohno and Shigeo Shingo in 1980. It has been used by organizations in most sectors including automotive, aerospace and construction. There are seven primary tools for use in value stream mapping:7

Table 1: Seven Value Stream Mapping Tools
These tools have varying purposes, but all demonstrate similar features. Each seeks to summarily visualize a complex process, quantify key indicators of performance, and provide decision support for a firm in day-to-day operations. Additionally, we see value stream mapping as a tool that can be leveraged to tune our focus on data necessary to make critical, emergency decisions in a value chain. Value stream mapping can help organizations strategize the best data gathering, monitoring, and reporting solutions to support their objectives and key results. Public, private, and non-profit organizations can better manage their contracts and supply chains with stronger market intelligence, supplier monitoring and contingency planning. To do this they require stronger signals for rapid decision-making. These signals must flow up from the value chain.
COVID-19 came at a time in our history when the global chain was not in America’s favor. In the last 20 years the global value chain has shifted to see China as the primary trade mediator from most of Europe and Asia to America.8 Some OEM supply chains can expand to as many as 1.25M suppliers at the various tiers, yet many have no idea who is in their tier 2 and below supply chain. Many of the products we needed to respond to the pandemic, such as N95 masks, other forms of PPE and pharmaceutical APIs all come directly from suppliers in China. We are also witnessing exponential growth in supply chain management concerns stemming from COVID-19 impacts on traditional supply chains and emerging supply chains popping up in response to COVID-19. Such concerns include:
Lack of tracking and tracing beyond the prime contract level
Lack of demand or need forecasting
Lack of disruption prediction, alerts, and responses
Growing fraud and counterfeit products and sources
Lack of supply chain human capital
Lack of channel distributer capacity
Lack of data fidelity and integrity for digitizing the SCM process
Ill-formed contracts as a result of ill-informed supply chains
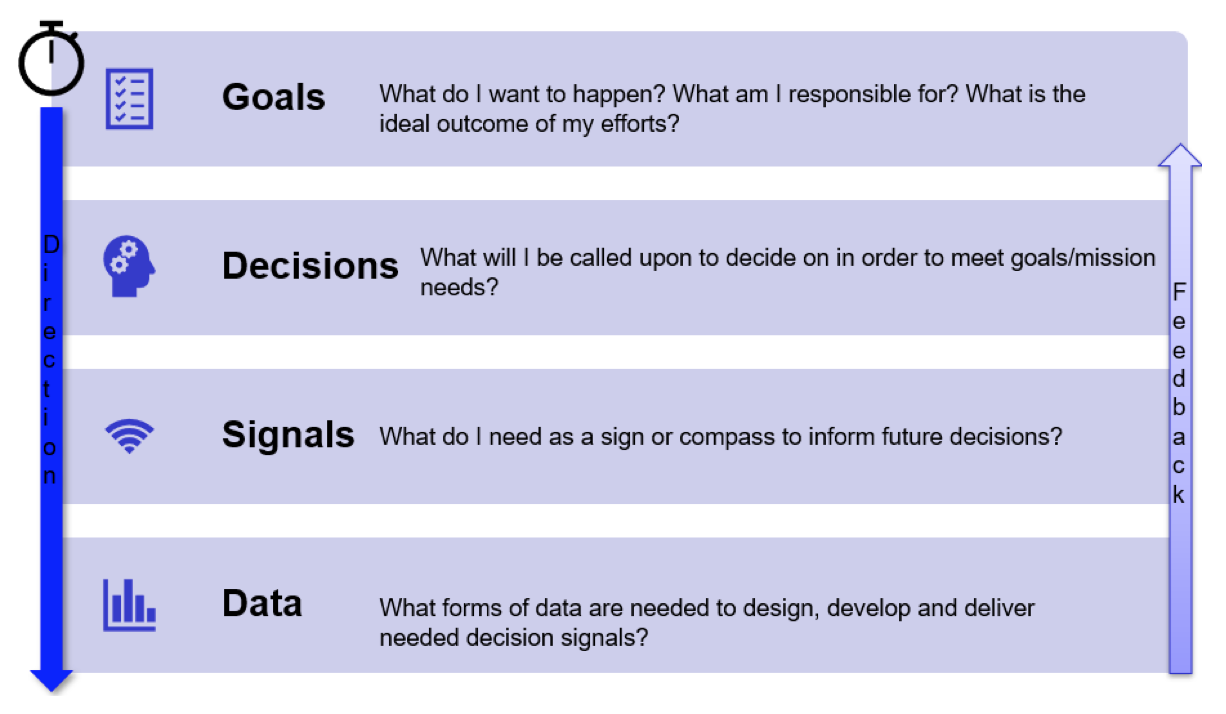
We are all aware that we need ‘better data’ for ‘better decisions’, but we can’t just keep grabbing at more data. We must have an intentional strategy to capture and use this data for supply chain and contract decisions. That starts with value stream mapping and replaces the OODA Loop with what we call the Goal-Decision-Signal-Data model (in the case of a healthcare value chain we begin with VSM):

Finkenstadt et al.’s Goal-Decision-Data-Signal Model
Step 1) VSM based on Goals: Lay out the entire value chain process in ‘stream’ form, from end customer (medical provider receiving PPE or patient receiving vaccine) all the way back to raw materials based on delivering to stated goals.
Step 2) Decisions: Ask yourself what critical decisions you will face in managing this value chain. What will you need better intelligence on for making decisions? (allocation of supplies, sourcing of critical human resources or technology, process, or policy changes, etc.). How will this impact sourcing instruments such as contracts? What flexibilities do we need?
Step 3) Signals: Ask yourself what would serve as a signal for decision-making? Do you need to know things like delivery delays, vendor vetting results, supply chain disruptions anticipated from weather or other disasters, market impacts from global policies, contract performance and delivery term issues etc.?
Step 4) Data: Ask yourself what data would lead to informative signals that can lead to intelligent decision-making within your focal value chain. Obtaining needed data will require collection. How do you collect it easier and with less threat of human or system error? Storing data takes capacity. How will you collect what you need and store it? Data hygiene is important. How will you ensure ‘clean’ data or clean data if it becomes corrupted? Data needs to be verifiable and protected. How will you ensure what you are collecting is real and immutable?
Continuous Feedback: Provide feedback up through the GDSD model, between all levels, to ensure that the data collected can provide the needed signals to inform the decisions necessary to meet the intended goals of the value chain. If it does not, then that data is not useful for this purpose. Also consider if the data collected, signals developed, or decisions made could impact other goals that may be of interest to the organization. In other words - don’t throw the baby out with the bathwater.
As mentioned before, failure to follow a GDSD model in a data saturated world can lead to misguided focus. The main goal of our response to COVID19 has always been to stop the spread. When we started with COVID19 response everyone was staring at epi model for the University of Washington. Why? Well mainly because that’s the initial focus of pandemic response, how many are sick or are expected to be sick, when, and where? But we quickly realized that that would not help us respond with action. It was just a clean visual of a nasty problem. We needed to make decisions about where to acquire needed materials and where to send them. Next, we started to receive data and interactive maps showing social distancing behavior and requested PPE and medical device needs from healthcare facilities. This was a step closer; we could see where spread was likely to occur, availability of hospital beds and the stated needs of these locations. This was much more useful yet is still missed vital data to provide a clear signal for decision-making. Material stock visibility issues were not accounted for. Such behaviors included hoarding behaviors and political motivations that misrepresented the required need for things like PPE, poor tracking and inventory management that led to misreported stock levels, and additional distribution information that would allow us to see potential barriers from sources and too delivery locations. Finally, after months of pandemic response, the CDC issued burn rate calculators that allowed medical facilities and support activities to estimate the needed levels of material based on usage rates. This should still be improved to rely on scanner technology to remove human error and misrepresentation, however, it is a step closer to the true data needed to meet the original goal…stop the spread of the virus. The CDC has just admitted that its response to COVID-19 was mismanaged, with unclear public communication and response that was late to need. Perhaps they are ready for a new model of data management and decision-making.
This is just a brief example of the problem with taking an observe, orient, decide and act approach to a data saturated world. Instead, we must use strategic foresight to ask ourselves what we want to happen in good times and in bad, what decisions will support our goals, what signals will support those decisions and what data is pivotal to developing such signals. Then we need to prioritize the curation and management of that data to enable more efficient and effective responses in the future. Firms and public agencies should shift their focus towards the GDSD model for managing data.
The views in this article are those of the author and do not reflect the official position of the DoD, Navy, or US Air Force
Handfield R, Finkenstadt DJ, Schneller ES, Godfrey AB, Guinto P. A Commons for a Supply Chain in the Post-COVID-19 Era: The Case for a Reformed Strategic National Stockpile. Milbank Q. November 2, 2020. https://doi.org/10.1111/1468-0009.12485
Boyd, J. R. (1996). The essence of winning and losing. (Unpublished briefing). Edited by Chet Richards and Chuck Spinney (2010). Retrieved from http://dnipogo.org/john-r-boyd/
Why Too Much Data Is A Problem And How To Prevent It (forbes.com)](https://www.forbes.com/sites/kimberlywhitler/2018/03/17/why-too-much-data-is-a-problem-and-how-to-prevent-it/?sh=d0c3f69755f3)
Handfield, R., and Linton, T. FLOW: How the Best Supply Chains Thrive, University of Toronto Press, 2022. https://utorontopress.com/9781487508326/flow/
Bejan, 2016, p 16.
Porter, Michael E., “Competitive Advantage”. 1985, Ch. 1, pp 11-15. The Free Press. New York.
Hines, Peter; Rich, Nick (1997). The seven value stream mapping tools. International Journal of Operations & Production Management; Bradford 17(1), pp. 64-46. DOI:10.1108/01443579710157989
Global Value Chain Development Report 2019, World Bank, World Trade Organization