California Management Review
California Management Review is a premier academic management journal published at UC Berkeley
by Ram Shivakumar

In a recent paper, Brent Neiman and Joseph Vavra (2020) find that whereas US households are devoting an increasing share of their expenditures to a small set of preferred products, the sets of products vary across households so that aggregate spending concentration has declined. The increase in niche consumption cuts across demographics, geographies, product categories and retailers. In this column, I contrast the economics of niche markets with the economics of mass markets using 2 frameworks — an economic value creation & value capture framework, and a network economics framework.
The value creation and capture framework starts with the axiom that every firm attempts to create & capture economic value. Creating economic value (EV) requires the firm to establish a wedge between the customers’ maximum willingness to pay (B) for the product and the unit cost (C) of “production.” Capturing economic value requires the firm to set a price (P) above unit cost (C) so that it earns a supra-normal profit.
Whether a firm captures EV depends on its contributed value (CV). CV is the difference between the EV created when the firm exists and the EV created if the firm does not exist. If the absence of the firm does not alter the creation of EV, the firm’s CV is 0. If the absence of a firm reduces the creation of EV, the firm’s CV is positive. Having positive CV is essential for it improves the bargaining position of the firm as it negotiates for a greater share of EV.
Panel A in Figure 1 analyzes value creation and capture in mass markets. Mass markets are characterized by the presence of a large number of customers with relatively similar preferences as well as the presence of large numbers of sellers and suppliers. Value creation and capture in mass markets is a proven exercise because customer value propositions are well understood and because firms have achieved a high degree of mastery over the production, distribution and marketing processes.
BMM and CMM are drawn as large rectangular boxes to indicate that aggregate willingness to pay and total cost (unit cost times volume) are large in mass markets because volumes are large. To convey the message that EV created is substantial, the vertical distance between BMM and CMM is represented by a thick line.
How EV is distributed across firms and consumers depends on the structure of markets. If mass markets approximate the textbook model of perfect competition, firms earn (on average) zero profits and consumers capture most of EV. If markets are monopolistically competitive, the average firm’s profit is positive while consumers also capture a share of EV. If markets are monopolistic, the firm captures the lion’s share of EV.
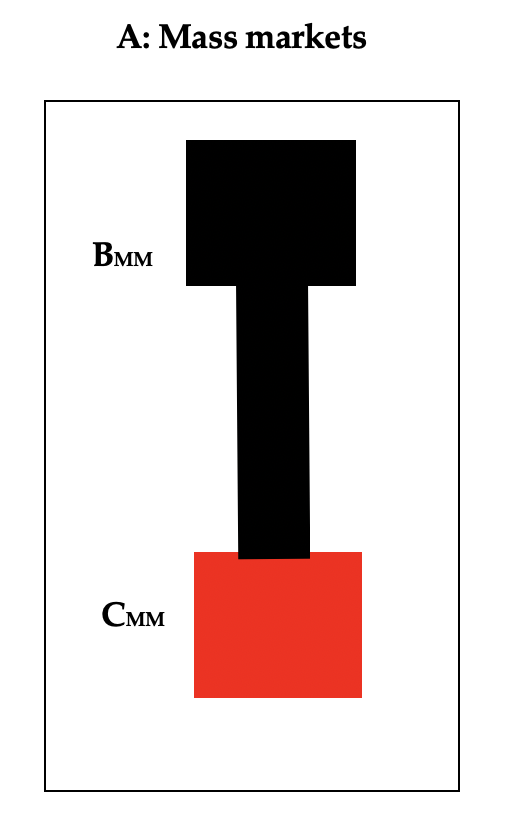
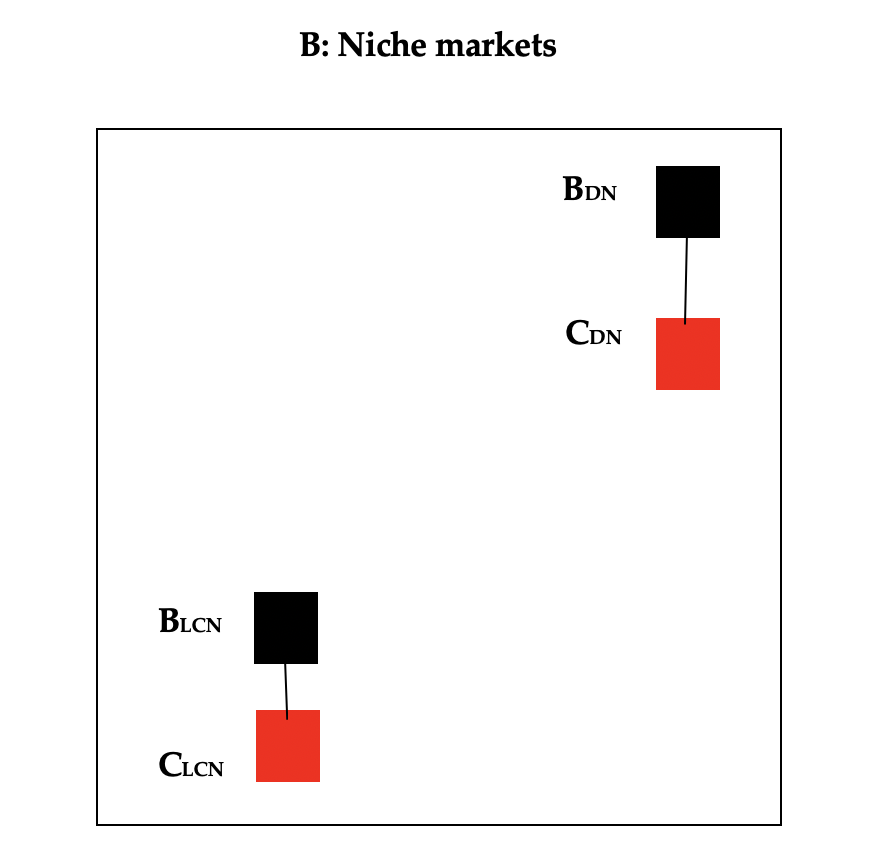
Figure 1: An Economic Value Interpretation
Panel B in Figure 1 examines value creation and capture in niche markets. The hallmark of niche markets is that they have a small numbers of consumers with specialized preferences as well as a small number of sellers. Unlike in mass markets, value creation and capture in niche markets are dynamic exercises. Customer value propositions are fluid and production, distribution and marketing capabilities need to be continually refined.
Niche markets can be classified as belonging to 1 of 2 types. Some niche markets cater to the low willingness-to-pay customer and can be categorized as low-cost (a-la Michael Porter). This category include ethnic restaurants, ethnic beauty salons and more. Other niche markets cater to the high willingness-to pay customer and can be categorized as differentiated (a-la Michael Porter). Examples of such markets include specialized consulting services, bespoke tailoring services, eco-tourism agencies, and more.
The economics of these 2 types of niche markets are dissimilar. In panel B, BLCN and CLCN are represented by small rectangular boxes indicating that aggregate willingness to pay and total cost (unit cost times volume) are small because volumes are small. That economic value created is small is indicated by the thin line connecting BLCN and CLCN.
The management challenges of operating in low-cost niche markets can be daunting. Acquiring and retaining the customer is an ever-present concern. The urge to hold on to customers prompts firms to spend substantial time, effort and money thereby raising unit costs.
The 2nd figure in panel B dissects the economics of differentiated markets. BDN and CDN are represented by rectangular boxes that are smaller than their counterparts in mass markets indicating that aggregate willingness to pay and total cost (unit cost times volume) are small because volumes are small. The vertical distance between BDN and CDN is smaller than economic value created in mass markets but bigger than in low-cost niche markets.
The management challenges of operating in differentiated niche markets are also unique. While customers have a high willingness to pay, their unique preferences force firms to invest substantial time and effort on creating customized products. The heterogeneity of preferences when coupled with low volumes makes it difficult for the firm to reduce unit costs.
The silver lining for niche-market players is that mass-market players are likely to be dissuaded from entering niche markets for several reasons. The EV up for grabs may be too small to be of interest, the value propositions of customers in niche markets are far too different from value propositions in mass-markets, and the capabilities required to serve niche markets are not ones that mass-market players possess. Quite often, mass-market players prefer to acquire niche market players if they have exhibited growth potential.
In some cases, niche markets may be perceived as a harbinger of the future. The electric car market is a good example. Though Tesla has sold many fewer electric cars than Ford has sold gasoline powered cars (192,000 versus 2.4m in 2019) and its revenue and net income smaller ($155.9B and $47M versus $24B and -$862M in 2019), its current market capitalization of $448B is more than 14 times greater than Ford’s current market capitalization of $31B.
In network models, value creation and capture depend on the network of connections that buyers and sellers have. Two ideas are emphasized in network models. First, not all buyers and sellers have the same depth and breadth in their network connections. Second, trading relationships (i.e, who trades with whom) and the terms-of-trade (i.e., prices) are determined by the alternatives that buyers and sellers have in their network of relationships.
Panel A in Figure 2 is an illustration of the network structure of a mass market. Buyers are denoted by number at the top of the figure and the sellers by number at the bottom of the figure. For simplicity, the number of buyers and sellers is restricted to equal 7. Note that buyers and sellers have distinct network connections. Buyers (and sellers) 1 and 7 are much less connected to the sellers (and buyers) than are buyers (and sellers) 2, 3, 4, 5 and 6: each has 2 connections. Buyers (and sellers) 2, 4 and 6 have only 3 connections to sellers (and buyers) while buyers (and sellers) 3 and 5 have 4 connections.
Broadly speaking, the structure of networks is denser in mass markets. That more buyers and sellers are connected to each other means that there are many more opportunities to transact and that there are many more ways that CV may be positive or zero.
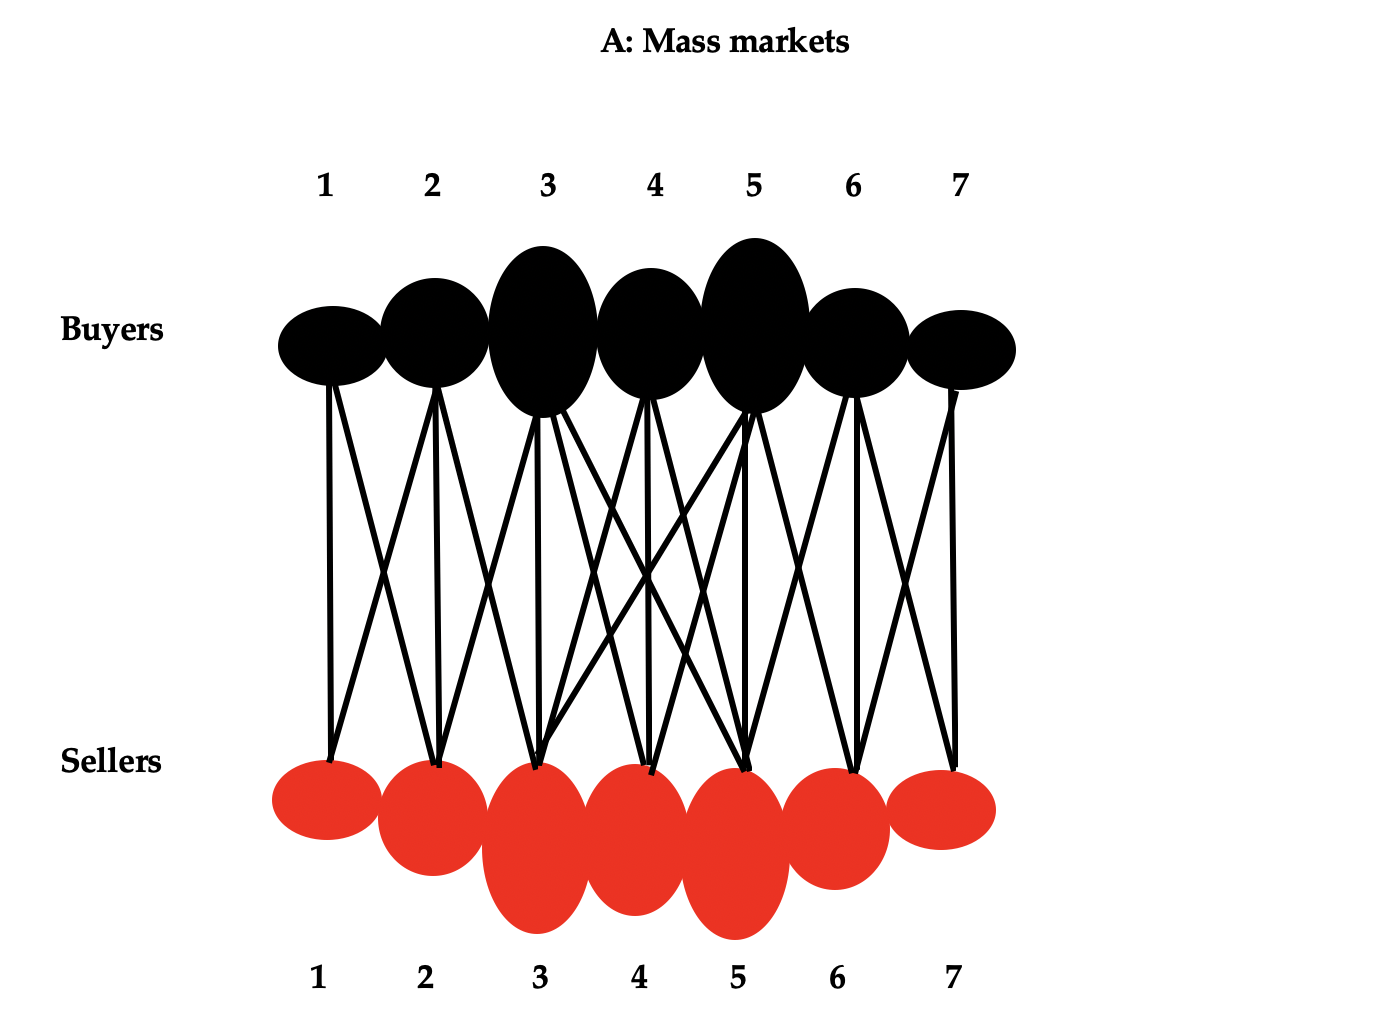
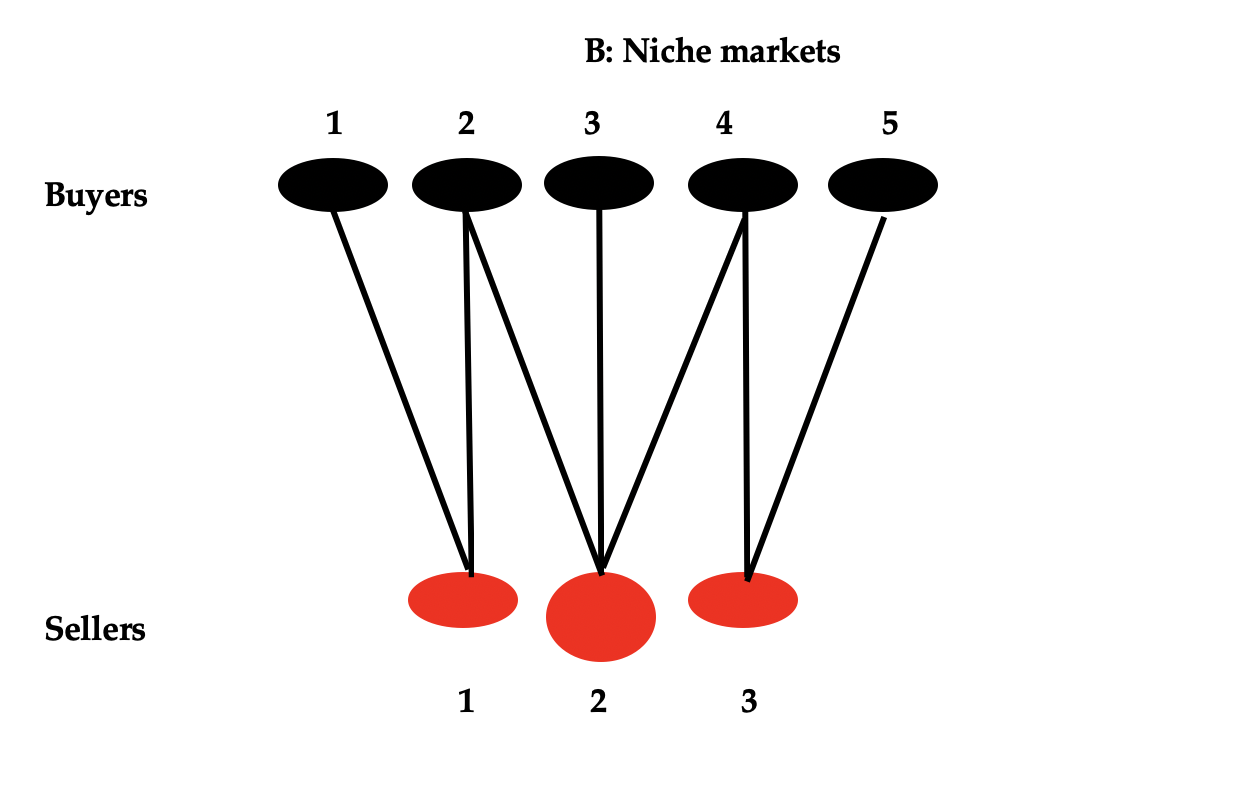
Figure 2: A Network Interpretation
Panel B in Figure 2 is an illustration of the network structure of a niche market. For simplicity, it is assumed that there are 5 buyers and 3 sellers. Note that buyers 1, 3 and 5 are connected to just 1 seller- sellers 1, 2 and 3. Buyers 2 and 4, on the other hand are connected to 2 sellers- sellers 1 and 2 and sellers 2 and 3 respectively. Examining the network positions of the sellers, observe that seller 2 is connected to 3 buyers (2, 3 and 4) while sellers 1 and 3 are connected to 2 buyers each (buyers 1 and 2, and buyers 4 and 5).
There are multiple Nash equilibria in this niche market. In one Nash equilibrium, seller 2 trades with buyers 2, 3 and 4 and sellers 1 and 3 trade with buyers 1 and 5. In a second Nash equilibrium, sellers 1 and 3 may (in addition) trade with buyers 2 and 4 respectively. Network structure determines how much value each player captures. The general message is that network structure is thinner in niche markets.
1. Easley, D. and J. Kleinberg, Networks, Crowds and Markets: Reasoning about a Highly Connected World, Cambridge University Press, 2010.
2. Neiman, B. and J. Vavra, “The Rise of Niche Consumption,” Working Paper, Booth School of Business, University of Chicago, October 2020.
Global Sustainability Frontrunners: Lessons from the Nordics
Essential Capabilities for Successful Digital Service Innovation at the Bottom of the Pyramid
Digital Transformation in Corporate Banking: Toward a Blended Service Model
Digital Platform Grafting: Strategies for Entering Established Ecosystems