California Management Review
California Management Review is a premier academic management journal published at UC Berkeley
by Nikhil Sikka and Seth Borin

Although a lot has been written about how to build an advanced analytics team, and what the organizational strategy should be to bridge the gap between business and advanced analytics teams, there is little advice on how to effectively “operationalize” an analytics team. The implementation of advanced analytics projects is still a major problem across industries. Based on a Gartner study, about 85% of analytics and big data initiatives fail to move past preliminary stages. Even of the projects that do get adopted, only about less than 20% provide any measurable business value. A recent survey across industries done by New Vantage highlights that 95% of the executives identify people and processes as the main obstacle to execution of these analytics projects. To say this is concerning is an understatement as billions of dollars will be spent on advanced analytics and AI initiatives—$59 billion globally by 2027 by one estimate.
One of the core problems for such abysmally low success rates is how analytics teams usually operate. All too often, analytics teams operate as “order takers” responding to half-baked requests from business stakeholders. The so-called problem discovery phase involves identifying a business problem where a data driven analytics solution has the potential to generate better predictions. With a shiny “data” problem in hand, the analytics team will go to town and build a sophisticated model that leverages cutting edge ML algorithms and so called big-data tools. But then, much to their surprise, the “advanced” analytics solution is snubbed by their stakeholders or does not get adopted. What happened? Far too often, a thorough understanding of paths and processes leading to business decisions is ignored and most of the time is spent on creating sophisticated algorithms. Instead of building tools and processes to ensure last-mile business integration, efforts are spent on data discovery, cleaning, and getting the “model” right. The professional development of the analytics staff and the choice of tools take precedence over business results.
In our several years of combined professional experience in the advanced analytics space, we have seen numerous times when analytics teams ignore people and processes at their own peril. To increase adoption of analytics initiatives, we need to put decisions and decision makers at the center, not technologies and algorithms. We argue that being close to the decisions—not only data—forces the analytics team to act like stakeholders themselves which ultimately leads to higher rates of adoption.
The following figure depicts the proposed workflow to carry out an analytics initiative in comparison to a typical structure. The standard workflow involves leading with data analytics to drive decisions whereas the proposed framework focusses on making decisions that are informed by analytics driven processes. The following section provides an in-depth discussion of these steps.
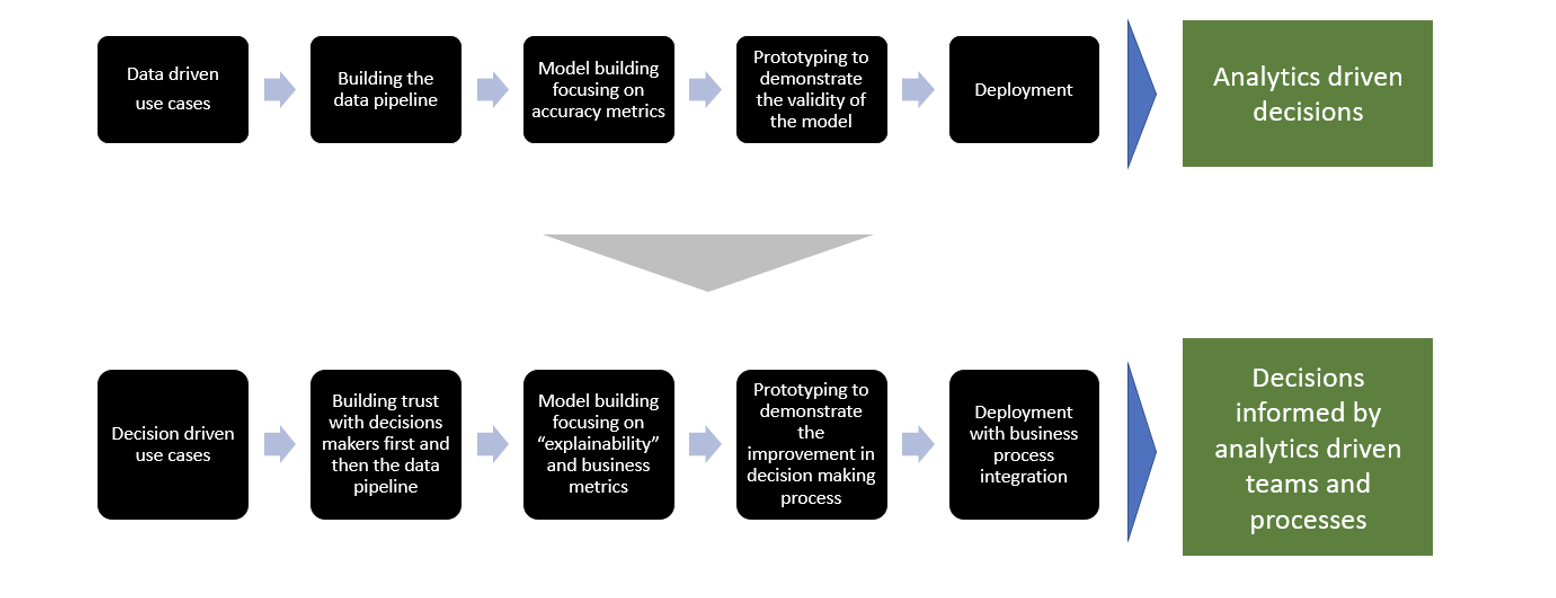
Figure 1: Analytics Workflow
To identify high value decisions, the analytics teams need to spend a significant amount of time in the trenches to understand how businesses are run on a daily basis. A thorough understanding of current business processes, the quality of decisions made along the way, and the people making those decisions leads to much more effective problem identification. High value decisions that are ripe for an analytics solution tend to fall at the intersection of their a) analytics feasibility, b) estimated business impact, and c) place in stakeholders’ priorities. If all these conditions are met, a decision has the potential to be informed by analytics driven processes. We have seen several failed analytics initiatives where efforts were launched even when one or more of these conditions were not met.
Research has shown that people are naturally averse to algorithms. They erroneously avoid algorithms after seeing them err, even if they are more accurate in general, and would prefer to choose a human forecaster over a statistical algorithm. Faced with an uphill battle, it becomes even more important to lead with a profound understanding of the “psychology” of decision makers rather than leading with “technology”, which can increase both the level of trust with stakeholders and the likelihood of adoption. The ideal situation is when the stakeholder considers you and your team as “thought partners” and not as a support function. It is necessary to begin by meeting with the “troops on the ground” to completely understand how decisions are currently being executed, what assumptions are made along the way, and what their frustrations are.
Powered with knowledge about the right decision(s) to tackle and a deep understanding of the stakeholders, now it’s time to think through solutions. The goal of the proposed analytics driven framework should be threefold: it makes your stakeholders more efficient, the modeling approach is explainable, and you can root-cause any significant fluctuations in the predictions. The analytics framework should use the insights from the subject matter experts in your stakeholder’s team as the data doesn’t always contain all the variables that go into decision making. The proposed solution should be framed as a joint venture with a shared performance scorecard between the business team and the analytics team.
Once you have the green light from your stakeholder with respect to the methodology, it’s time to start doing the actual “data science” or “advanced analytics.” This is where the data science team can provide massive value through their technical knowledge, algorithm thinking, and data savviness. However, the focus here shouldn’t just be on validating the model accuracy. Instead, the analytics solution should lead to a more data driven decision-making process leading to better business outcomes. The analytics team should create a prototype, conduct quick A/B testing, and track improvements in underlying metrics that define good decisions. If initial testing leads to desired or better outcomes, move towards creating a minimum viable product (MVP) that stakeholders can start using effectively and which can be field tested.
This is when the rubber actually meets the road. After the clear value of the analytics product has been demonstrated, the team needs to make sure that it can be fully integrated into the business processes, and they have the right resources to scale it up for full implementation. This requires support of all parties involved including the engineering team, the analytics team, and the business team. It’s very important that the team marches on to get to the finish line. The job doesn’t end after the analytics solution has been fully built out—you also need to have a “maintenance” plan to keep improving and updating the underlying methodology, data, and logic.
The operations analytics and data science team at one of the largest department stores in the US practices the decision backward approach on a regular basis to provide value to their business stakeholders. Let’s illustrate with an example how they have successfully used the abovementioned framework for a high value business and operational decision.
Stage 1: Identifying a high value decision
After spending significant time to understand the current business processes, the analytics team identified a high value business decision that was ripe for an analytics solution. In particular, the business team had an inventory utilization problem that drove multi-million-dollar warehouse planning decisions (satisfying the business value merit). Private label goods account for a significant portion of both units and dollars sold at the company. Order decisions were made up to one year prior to receipt, so up to 30% of ordered units are held in the warehouse to fill in stores as the need arises throughout the season (high on stakeholders’ list of priorities). The analytics teams realized that building a prescriptive analytics engine into the system would allow for revenue to be maximized on the sunk cost of the goods by understanding the current and future value of the merchandise in the warehouse (feasible from an analytics standpoint).
Stage 2: Building trust
Operating as thought partners, as opposed to a support function, the analytics team worked with the merchant team’s managers and spent days to make sure the business model was completely understood. Moving all of the merchandise to stores too early in the season means that all of their bets had been placed prior to gaining information about how stores would sell the product throughout the season. Waiting too late to transfer the merchandise means that there were opportunities to sell merchandise at full price that are now destined to sell at a reduced price.
Stage 3: A “joint venture” with shared performance metrics
Instead of typical model evaluation metrics like turns or year-over-year inventory dollars by store, the analytics and business brainstormed metrics that drove real business value. After various discussions, in-stock rates and revenue were jointly decided as the key metrics for both the business and analytics teams. The business stakeholders were also interested in the amount of inventory remaining in the warehouse in comparison to the initial purchase quantity so that they could track the behavior of the model in fitting their business needs and higher-level metrics. Being understocked in stores early in the season and overstocked in the warehouse at the end of the season (or vice versa) would show that the model needed to be reevaluated. The shared performance metrics made sure that both teams were vested in the success of the analytics solution.
Stage 4: Prototyping
Several illustrative predictive models were run on historical data. The analytics teams created a prescriptive modeling engine by automating data collection, model building, and sharing of the results, leading to a much more effective decision-making process. Merchandise was selected using both the business stakeholders’ expertise and the raw results from the analytical models. The analytics team monitored business metrics and regularly checked in with the business unit throughout the season, to make sure that the testing period was robust enough to generalize the model.
Stage 5: Business integration
After seeing the results of the pilot, both the business stakeholders and the analytics team felt comfortable in rolling the solution out to the rest of the merchandise as appropriate. Specific tools were created for business teams to easily access the model results and root-cause any significant deviations. This level of trust with the initial merchant group has allowed conversations with merchants in other categories who have similar business cases to move quickly.
The working arrangement for analytics teams needs a paradigm shift. Analytics teams need to follow decisions backwards by aligning themselves close to the decisions, not only data and/or technology. Leading with decisions to be made and having skin in the game forces analytics teams to act like stakeholders themselves which ultimately leads to better project planning and higher rates of adoption.