California Management Review
California Management Review is a premier academic management journal published at UC Berkeley
by Christian Blanco, Calvin Spanbauer, and Sara Stienecker
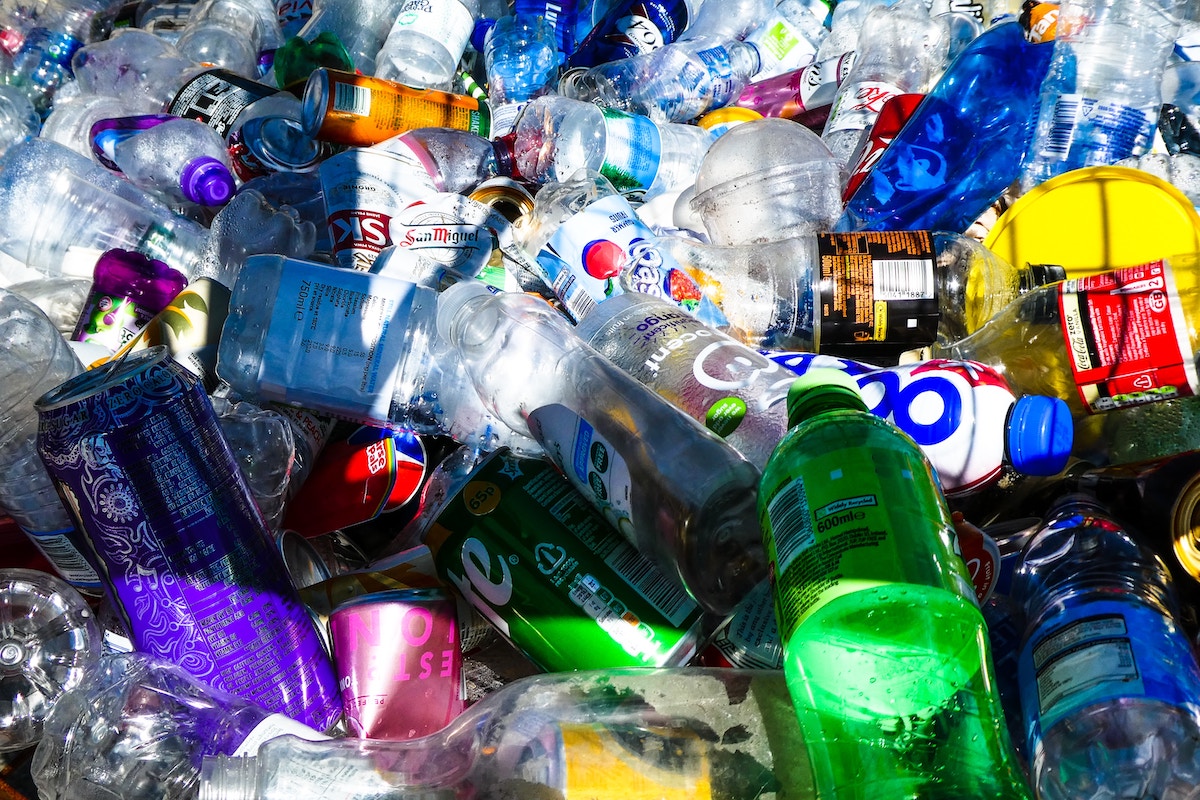
Image Credit | Nick Fewings
Recycling can be a powerful tool to keep waste out of landfills and even turn it into profitable manufacturing inputs. Unfortunately, the American recycling system has five major shortcomings that result in only 32.1% of waste being either recycled or composted. This article describes the current shortcomings of the American recycling system and explains how those shortcomings cause recyclable material to be landfilled (called ‘leaks’). This is the first article in a two-part series on America’s recycling industry. The second article, entitled “Is it time for a national recycling standard?” discusses how standards could improve financial and environmental outcomes.
“Stakeholder Views on Extended Producer Responsibility and the Circular Economy” by Nathan Kunz, Kieren Mayers, & Luk N. Van Wassenhove. (Vol. 60/3) 2018.
Americans were among the early leaders in curbside recycling. However, today the United States lags behind in global recycling efforts. The current regulations governing solid waste management in the U.S. were codified under the Resource Conservation and Recovery Act1 in 1976. That means it’s been more than 47 years since the U.S. updated its approach to waste management.
The dated approach of the U.S. recycling system is bad for American businesses. For example, the U.S. lacks geographic consistency in which products are accepted for recycling. Research, including our survey of nine major cities, shows that inconsistent recycling practices lead to consumer confusion and sorting errors. These sorting errors are costly – particularly putting a non-recyclable product into the recycling stream, called contamination. Contamination costs the material recovery facilities that sort recyclables at least $300 million per year in additional labor, processing, and machinery repairs.2 Ultimately, this increases the cost to downstream manufacturers.
America’s dated approach to recycling is also bad for the environment. About 1.8 million acres of land in the U.S. is lost to landfills. Recycling diverts waste from these landfills, yet only 32.1% of American waste is currently recycled or composted4 There is so much opportunity for the recycling market to create more financial value and conserve our natural resources.
The U.S. recycling market has five critical shortcomings. Before we dive into the details of these shortcomings, it’s helpful to see a quick overview of how the industry works.
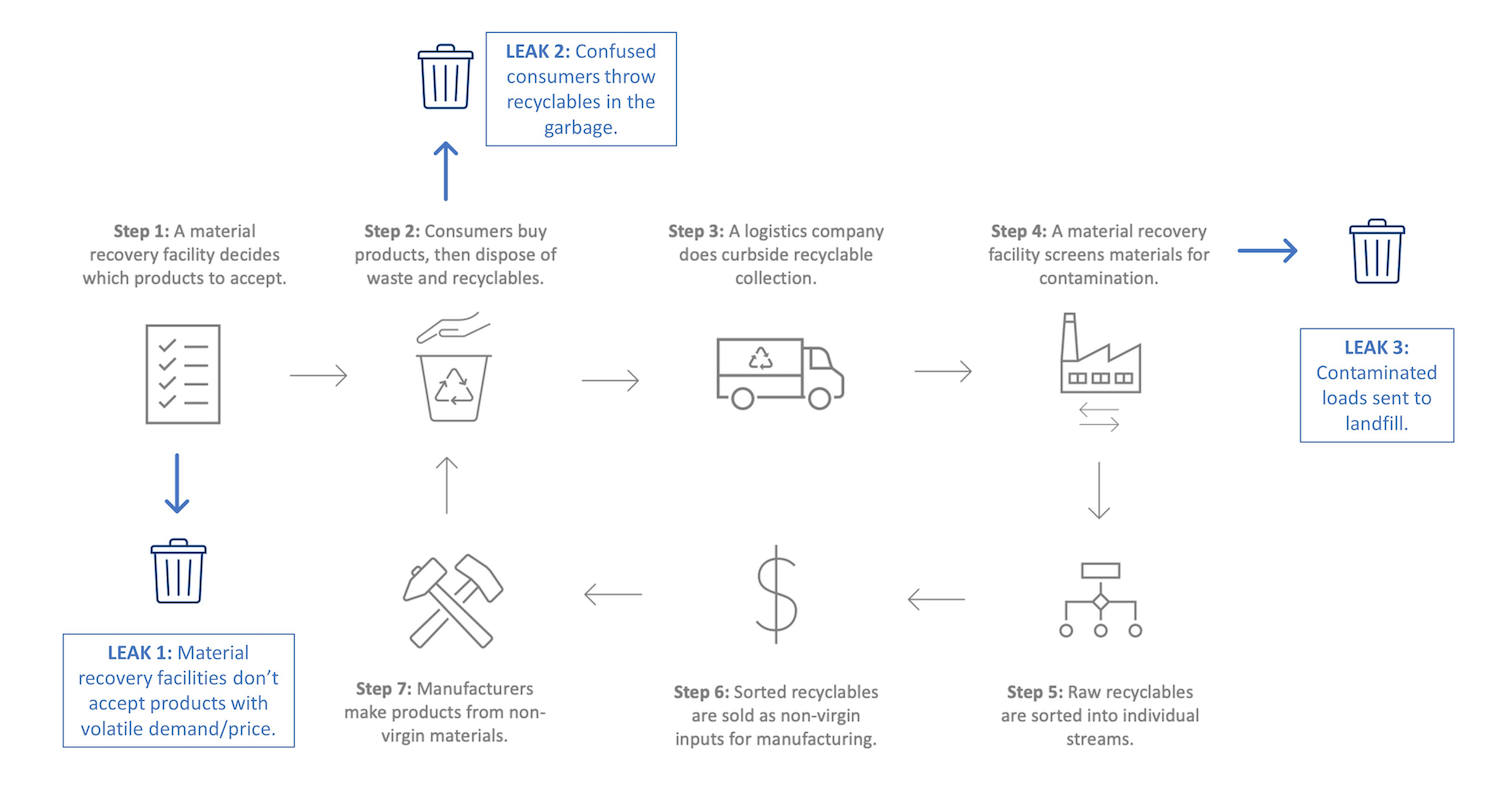
Figure 1: America’s recycling system
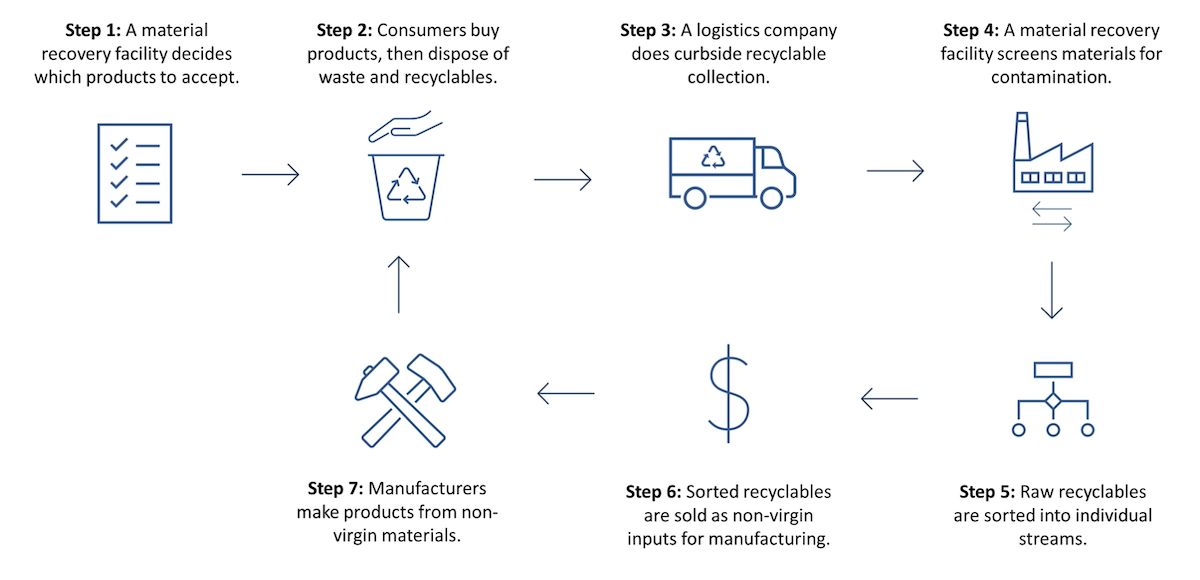
Notes: The double arrows are meant to represent the decision making process at the sorting facility (e.g. accept the load and begin sorting, or reject the load because it is too contaminated and send it to landfill.)
Step 1: A material recovery facility decides which products to accept.
The waste management process begins when a municipality selects a material recovery facility to service their region. The material recovery facility is a private or public company that sorts recyclables into clean streams of products that can be sold for remanufacturing. The recovery facility makes decisions about which products it will accept based on (1) the market for recyclables, (2) the equipment and labor it possesses, and (3) the scale of potential materials that can be collected.
Step 2: Consumers buy products, then dispose of waste and recyclables.
Consumers purchase goods and dispose of the resulting waste at home. This process involves sorting recyclables from non-recyclable waste. The consumer’s ability to dispose of waste accurately depends on their knowledge of which products are recyclable in their region. Consumers typically don’t spend much time thinking about how to correctly dispose of their waste, yet knowing which items are recyclable is critical, as we will show in this article.
Step 3: A logistics company does curbside recyclable collection.
A logistics company (sometimes owned by the same parent company as the material recovery facility) is responsible for collecting curbside waste. The logistics company collects household recyclables and delivers the truckloads to a material recovery facility to be sorted into individual streams.
Step 4: A material recovery facility screens materials for contamination.
The raw recyclable waste that comes in from logistics companies will cost less to process if there is little to no contamination.5 At the recovery facility, the logistics vehicle is weighed on a scale and a visual inspection is performed. The inspection is intended to evaluate the quality of the raw recyclable waste and determine if the contamination will impact the recovery facility’s processing capabilities. If the contamination exceeds the tolerable threshold, the load is rejected and brought to the landfill.
Step 5: Raw recyclables are sorted into individual streams.
Once a load is accepted, the recovery facility separates the raw recyclable waste into its individual products, for example, corrugated cardboard or #2 plastics. The process for this varies from facility to facility. Some facilities depend heavily on human labor to sort products while others have more technology to automate the sorting process.
Step 6: Sorted recyclables are sold as non-virgin inputs for manufacturing.
Once the recyclables are sorted, the individual products can be sold for re-manufacturing. The material recovery market is divided into six regions across the U.S. The market is similar to other commodity markets where the price is determined by a bid system.6 Long-term contracts also exist, albeit less popular because this may be more costly to the processor. The cost a material recovery facility pays to collect, sort, compact, and bail recyclables remain fixed, but the demand and the price they can charge for their product fluctuates. This means that sometimes recovery facilities are profitable – and sometimes they are not.7
Step 7: Manufacturers make products from non-virgin materials
Manufacturers interested in closing the loop can commit to sourcing non-virgin materials as inputs to their production. Yet, they will only do so if they find that purchasing recycled material is more cost-effective or profitable. To close the loop, the recycling industry needs to scale and become more efficient at collecting, segregating, and reselling recycled material.
To better understand how the U.S. recycling system is performing, our team conducted a survey of recycling practices across nine major American cities in 2020. We selected cities with variations in how they manage residential recycling and waste. The nine cities include San Francisco, Los Angeles, Seattle, Austin, Columbus, Nashville, Boston, Portland, and Chicago. We then recruited 282 participants who reported living in one of the nine cities through Amazon Mechanical Turk.
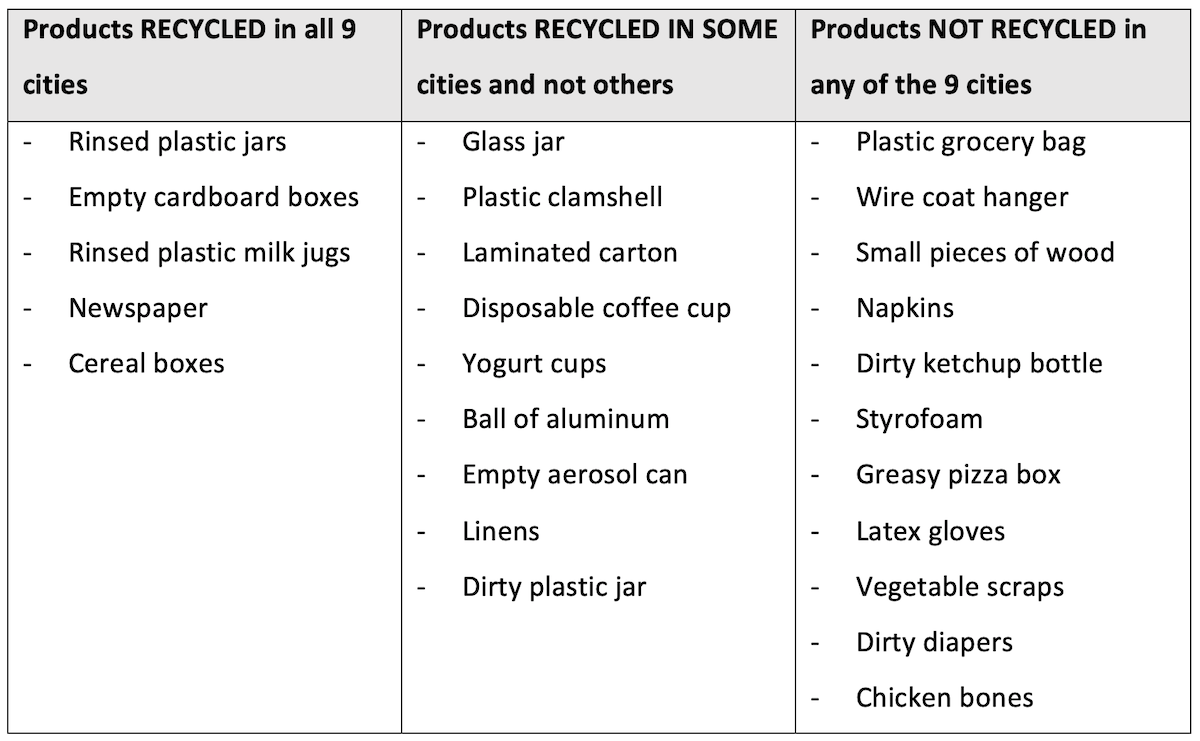
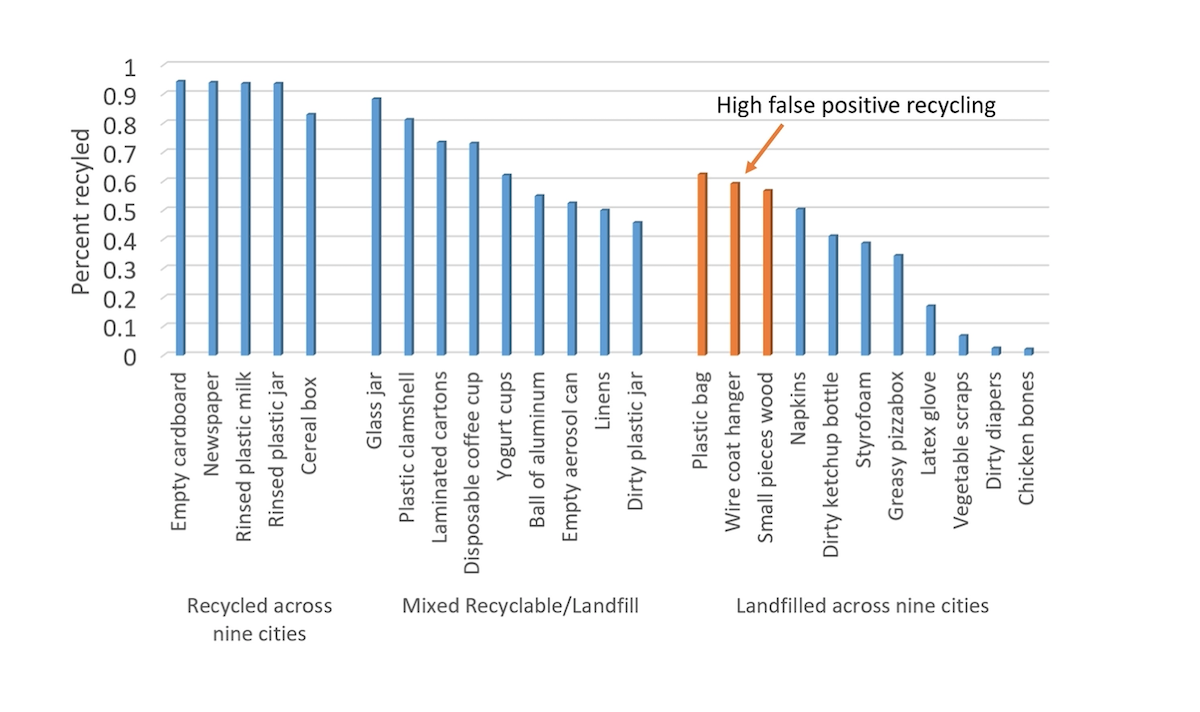
We included 25 items in our survey. We purposefully chose some products that were landfilled across all nine cities, some that were recycled across all nine cities, and some with municipal variation in end-of-life practices.
Table 1: Products included in the survey
The sections below use our survey findings to characterize the five core shortcomings of the U.S. recycling system.
Figure 2: Five shortcomings of the recycling system
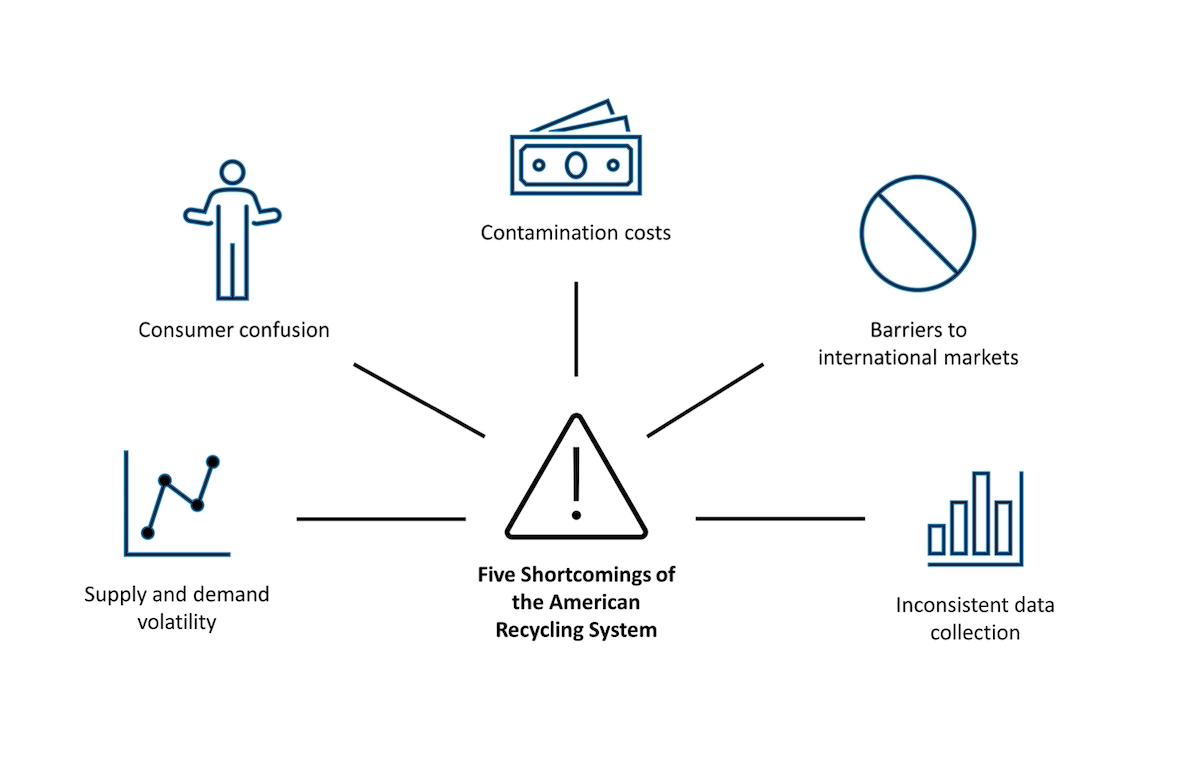
1. Supply and demand volatility
Some products, such as corrugated cardboard and rinsed plastic jars, have predictable processing costs, stable demand from manufacturers, and stable supply from consumer waste streams. This is good for all businesses in the recycling supply chain. These products offer a consistent return on investment for processing facilities and reliable availability for manufacturers. Unfortunately, market stability is not the reality for most recycled products.
Supply volatility happens because recycling practices vary widely from region to region and over time. For example, our study included nine products that were accepted in some cities and not in others, including glass jars, plastic clamshells, and laminated cartons. This variation happens because regional recovery facilities make autonomous choices about which products to accept based on the expected return on investment, which introduces geographic differences in supply availability. Processing facilities can also change the products they accept over time, which introduces temporal volatility in supply.
There are also inconsistencies in the classification of grade or quality. A manufacturer may pay for non-virgin material of a certain grade, measured using the weight of recyclable content to total weight of the bale, but receive material of lower quality. In some cases, the quality of a bale is not guaranteed prior to shipment, and buyers are aware of these risks in purchasing from processors.
Short-term demand volatility can result when manufacturers buy in batches. For example, if a paper manufacturer commits to using 50% recycled paper in their products, that 50% is an annual average. This means they can choose to purchase no recycled material when prices are high, then buy in bulk later in the year if prices drop.
Consumers also pay the cost of volatility through sustainability/recycling adjustment fees and rebates, which gives customers a credit when prices at the market are favorable, and charges customers a fee when prices at the market are unfavorable.
2. Consumer confusion
The consumers that participate in recycling play the critical role of sorting recyclables at the point of disposal. The accuracy of consumer disposal decisions directly influences the performance of the recycling system. In one survey, 94% of U.S. residents said they support recycling,8 reflecting a strong willingness to participate but a striking mismatch with the actual rate of recycling at 32-34%.9 The effectiveness of recycling further deteriorates due to contamination. In a separate study, roughly one out of four items (or 25%) are incorrectly placed in the recycling bin.10 Our findings in this study indicate that the error rate for recycling is even higher than these two studies suggest. The accuracy with which consumers correctly dispose of items into the recycling dramatically impacts the effectiveness and cost of the recycling system.
In waste disposal, not all errors are the same. There are two types of errors that consumers can make as they sort their waste – false negatives and false positives. A false negative refers to the scenario where a consumer throws a recyclable product into the garbage. This represents another leak in the recycling system, whereby an item that could have been recycled does not get recycled. A false positive, also called ‘contamination,’ occurs when a consumer puts a non-recyclable product into their recycling bin. The cost of contamination is much higher than the cost of throwing a recyclable in the garbage. We will return to this cost argument in the next subsection.
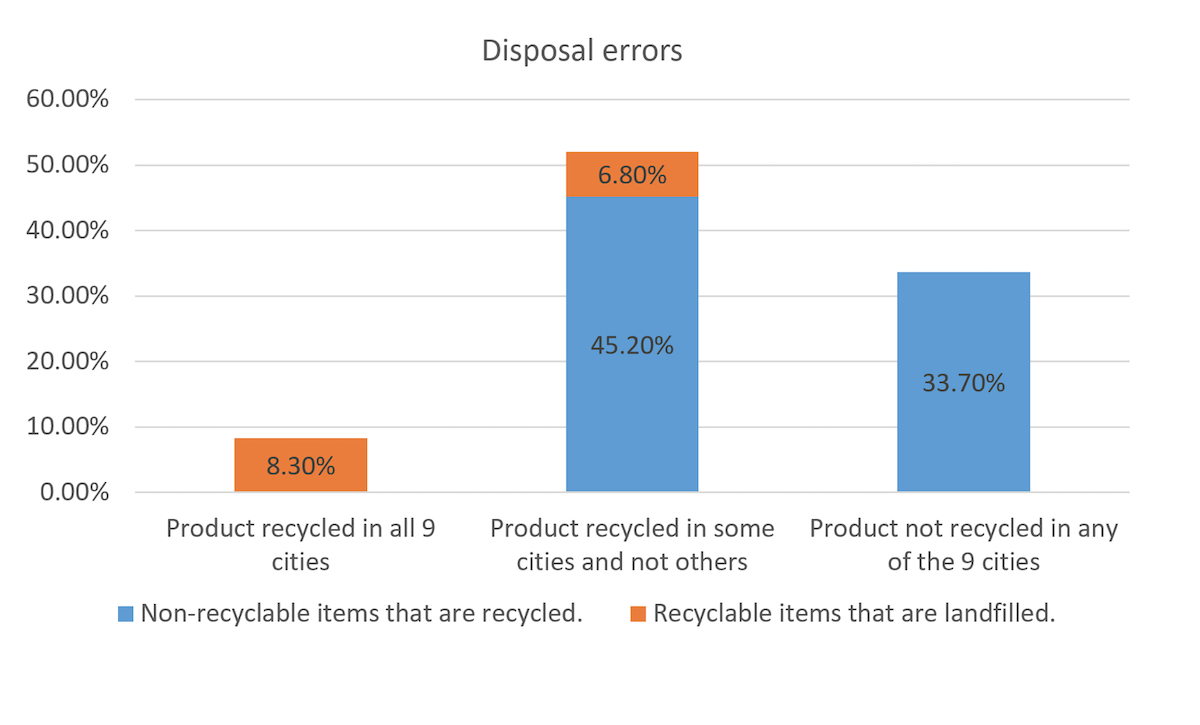
The geographic consistency of recycling practices helps consumers to know with more certainty which products are recyclable. Our results show that geographic consistency in which products are accepted for recycling is a key factor in improving sorting accuracy. Our data show that products that are recyclable across all nine cities had a very low error rate of 8%. Products that were not accepted in any of the nine cities had a higher disposal error rate, at 33.7%, but this was still lower than the 52% error rate of products that were accepted in some cities but not in others (See Figure 3). Additionally, our study shows that the more cities that recycle a particular item, the lower the error rate becomes. The correlation between disposal accuracy and the number of cities that recycle an item is 0.63, supporting the idea that a more uniform recycling practice across the U.S. could lead to lower disposal errors.
Figure 3: Disposal errors by product
3. Contamination costs
When a consumer throws a recyclable item into the garbage, it results in an opportunity cost; one item whose value could have been captured through recycling, which will instead sit in a landfill. There are also landfilling costs of throwing away recyclable materials, but landfilling costs are substantially smaller than the cost of processing a contaminated recycling supply chain. Contamination cost is the cost when a consumer throws a non-recyclable into their recycling bin. The contamination cost is higher than the opportunity cost and the cost to landfill combined.
Contamination is costly for logistics companies. Collected curbside recycled materials are screened by the recovery facility. If the screening reveals excessive contamination, the entire load is sent to the landfill. This creates another leak in the recycling system, whereby large volumes of recyclable materials do not get recycled.
According to data from New York City, the average cost to collect recyclables is $686 per ton.11 Contaminated recyclable loads are disposed of at an average of $80 per ton.12 This means that contaminated recyclable loads cost logistics companies as much as $766 per ton. In contrast, the average cost of collecting waste without segregation is $126.03 per ton. This data is from New York, so it cannot be directly extrapolated to other cities. There is lack of data for other municipalities, commanding the need for more research in this area.
The total contamination costs across all recovery facilities in the U.S. is at least $300 million per year in additional labor, excess processing, poor material quality, longer downtime due to equipment damages,13 and increased safety hazards. This results in recovery facilities often being cost centers instead of profitable businesses. Ultimately, this increases the cost to downstream manufacturers.
Unfortunately, past research shows contamination (false positives) is a far more common disposal error than false negatives. This happens because of ‘wish-cycling,’ a phenomenon where well-intending consumers encounter an item that they are not sure how to sort and end up putting it in the recycling bin in the hopes that the item can be recycled. In our study, within the group of recyclable items accepted in some cities but not others, the overall error rate was 52% (the middle bar graph in Figure 3). Of those errors, 87% were false positives (or contamination). This captures wish-cycling in action. When people are unsure how to dispose of something, they typically try to recycle it.
Our study also sheds light on a potential solution to contamination. Although there is still a significant amount of disposal error amongst products that are not recycled in any of the cities, the false positive rate of this category of products is 12% lower than the false positive rate amongst products that are accepted in some cities and not in others (see the middle and rightmost cluster of products in Figure 4). This finding suggests that more uniform policies regarding what is and is not accepted could reduce contamination costs.
Figure 4: Average disposal error rates across different categories
4. Barriers to international markets
Contamination also poses a unique challenge for U.S.-based recycling exporters. Prior to 2018, China was a leading global importer of recycled materials and had very high tolerances for contamination. This meant that American recycling exporters could send even highly contaminated loads of recyclables to China for profit. As of 2017, 31% of all U.S. scrap went to China.14
In 2018, China implemented a strict waste import policy called National Sword. With the implementation of the National Sword, Chinese inspectors could only accept loads if15 they contain less than 0.5% contaminated product in plastic bales, 1% in ferrous and nonferrous metals, and 1.5% in scrap paper.16 The average quality requirement in the U.S. is 25% contamination. American recyclers cannot meet these standards, so the profitability of recycling crashed overnight.17 The effects were particularly acute in coastal recycling markets, which depended more heavily on export revenue.
5. Inconsistent data collection
Low-quality and contaminated recycling materials are pre-competitive challenges. These issues impact the profitability all companies in the recycling industry, including logistics companies, material recovery facilities, and manufacturers and reduce the competitiveness of the U.S. recycling industry on an international scale. Yet there is very little data available and minimal sharing of best practices to improve collective performance.
During our study, our team discovered an extreme lack of data on core topics, such as which products are accepted in each municipality. The only way to find this data was to examine each municipality’s website individually. There is even less data available related to the contamination rates of raw or processed materials. Reporting and accessing these data is the first step to understanding which processes cause and prevent contamination and disseminating these best practices nationally. Cost estimates, the volume of traded recyclables, and contamination rates are hard to compare, so it is very difficult to conclude what is and isn’t working.
The shortcomings identified above ultimately create three major ‘leaks’ in the recycling system, whereby potentially recyclable materials end up in the landfill. Those leaks are:
Leak 1: Material recovery facilities don’t accept products with volatile demand or price, meaning those products are sent to landfill.
Leak 2: Confused consumers throw recyclable products into the garbage.
Leak 3: Contaminated loads or raw recycling collected by a logistics company are rejected by material recovery facilities and sent to landfill.
Figure 5: Three Leaks in the American Recycling System
These leaks are so significant that only 32.1% of American waste is currently recycled or composted.18 These leaks hurt the U.S. financially, as companies miss the opportunity to capture financial value from waste. Other hidden costs of landfills are hard to quantify, including Greenhouse Gases that contribute to climate change, the release of toxic and forever chemicals that pose health issues, and the deterioration of property and land values.19,20 The leaks also hurt the U.S. environmentally, as recyclable materials needlessly end up in landfills.
There is so much opportunity to patch leaks in the American recycling system, so we can create value and conserve our natural resources. Patching the leaks will require a market that is able to carefully and efficiently balance supply and demand and radically reduce the costs of contamination. In the second article, we discuss the potential role of a national recycling standard in strengthening the U.S. recycling system.
EPA, “Resource Conservation and Recovery Act (RCRA) Regulations,” August 2022, https://www.epa.gov/rcra/resource-conservation-and-recovery-act-rcra-regulations#nonhaz.
Recycling Partnership, “2019 West Coast Contamination Initiative Research Report,” May 2020, http://recyclingpartnership.org/wp-content/uploads/2020/04/The-Recycling-Partnership_WCCI-Report_April-2020_Final.pdf.
Vasarhelyi, Kayla. “The Hidden Damage of Landfills.” University of Colorado Boulder, Environmental Center. April 2021, https://www.colorado.edu/ecenter/2021/04/15/hidden-damage-landfills.
EPA, “National Overview: Facts and Figures on Materials, Wastes and Recycling,” December 2022, https://www.epa.gov/facts-and-figures-about-materials-waste-and-recycling/national-overview-facts-and-figures-materials.
EPA, “Frequent Questions on Recycling,” Last accessed November 2022, https://www.epa.gov/recycle/frequent-questions-recycling#recycling101.
Waste 360, “Reducing Recycling’s Risks: Share the Pain, Share the Gain,” January 1998, https://www.waste360.com/mag/waste_reducing_recyclings_risks
Iyer, A. V., Vedantam, A., & Lacourbe, P. (2023). Recycled content claims under demand benefit and supply uncertainty: Multi-period model and application to glasswool insulation. European Journal of Operational Research.
Storymaps ArcGIS, “Contamination in Recycling,” July 2021, https://storymaps.arcgis.com/stories/145063284501409cb2516770ebaf0865.
Storymaps ArcGIS, “Contamination in Recycling,” July 2021, https://storymaps.arcgis.com/stories/145063284501409cb2516770ebaf0865.
Recycling Partnership, “2019 West Coast Contamination Initiative Research Report,” May 2020, http://recyclingpartnership.org/wp-content/uploads/2020/04/The-Recycling-Partnership_WCCI-Report_April-2020_Final.pdf.
Husock, Howard. “The Declining Case for Municipal Recycling.” June 2020. https://www.manhattan-institute.org/recycling-cost-benefit-analysis.
Ibid.
Recycling Partnership, “2019 West Coast Contamination Initiative Research Report,” May 2020, http://recyclingpartnership.org/wp-content/uploads/2020/04/The-Recycling-Partnership_WCCI-Report_April-2020_Final.pdf.
Miller, Randy. “Contamination in Recycling Costs Business Money.” January 2020. https://millerrecycling.com/recycling-contamination-costs-money/.
Miller, Randy. “One Month into China’s National Sword Recycling Program.” February 2018. https://millerrecycling.com/one-month-china/.
Katz, Cheryl. “Piling Up: How China’s Ban on Importing Waste Has Stalled Global Recycling.” Yale Environment 360. March 2019, https://e360.yale.edu/features/piling-up-how-chinas-ban-on-importing-waste-has-stalled-global-recycling.
Vedantam, Aditya, Nallan C. Suresh, Khadija Ajmal, and Michael Shelly. “Impact of China’s National Sword Policy on the U.S. Landfill and Plastics Recycling Industry.” Sustainability 14, no. 4 (2022): 2456.
EPA, “National Overview: Facts and Figures on Materials, Wastes and Recycling,” December 2022, https://www.epa.gov/facts-and-figures-about-materials-waste-and-recycling/national-overview-facts-and-figures-materials.
Recycling Partnership, “The Hidden Cost of Landfilling vs. Recycling,” January 2023, https://recyclingpartnership.org/the-hidden-cost-of-landfilling-vs-recycling/.
EPA, “Basic Information about Landfill Gas,” September 2022, https://www.epa.gov/lmop/basic-information-about-landfill-gas.