California Management Review
California Management Review is a premier academic management journal published at UC Berkeley
by Mike Grandinetti and Ikhlaq Sidhu
Image Credit | Stephen Phillips - Hostreviews.co.uk
Marketing teams have embraced predictive analytics in order to anticipate customer needs and actions. However, for most companies, last year’s sales data is not representative of the past or the future. Until early 2020, trend lines and forecasts were largely predictable. Recently, sales have been abnormal due to pandemic effects. In many cases, companies have seen business fall off dramatically, across travel and hospitality, sports and entertainment, and elective surgery.
“Preparing Organizations for Greater Turbulence” by Paul J. H. Schoemaker & George Day
“Data-Driven, Data-Informed, Data-Augmented: How Ubisoft’s Ghost Recon Wildlands Live Unit Uses Data for Continuous Product Innovation” Karl Werder, Stefan Seidel, Jan Recker, Nicholas Berente, John Gibbs, Nouredine Abboud, & Yossef Benzeghadi
Now that we’re approaching a “New Normal”, companies struggle with how to predict customer behavior. Given the prolonged gap in customer data, marketing analytics teams are finding that sales patterns are not predictive for post - pandemic sales forecasting.
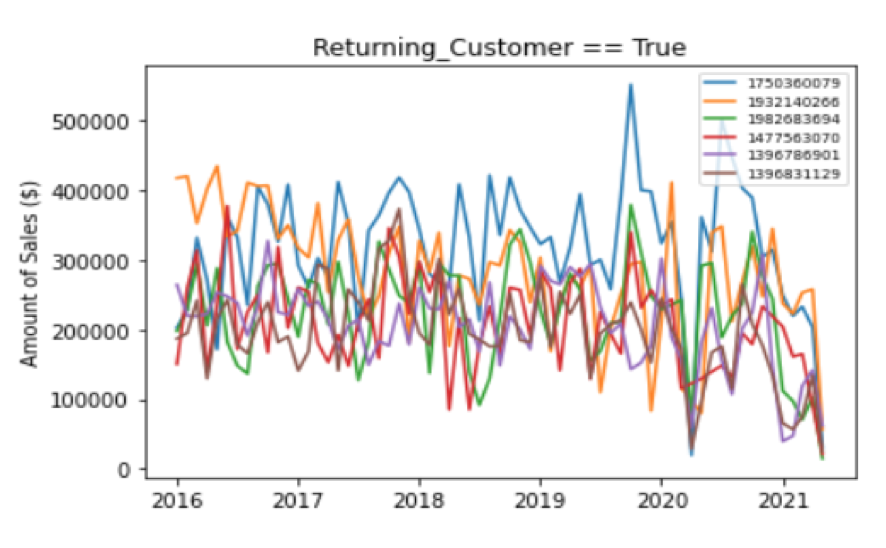
The question that many firms are asking is “when will we return to normal / is there a new normal” post-pandemic? The graphs below illustrate the type of analysis that companies can perform to overcome the aberration of data.
We recently completed a 3-week applied research project to analyze customer data for a biomedical firm. Like many others we’ve worked with, they were wondering if it was possible to:
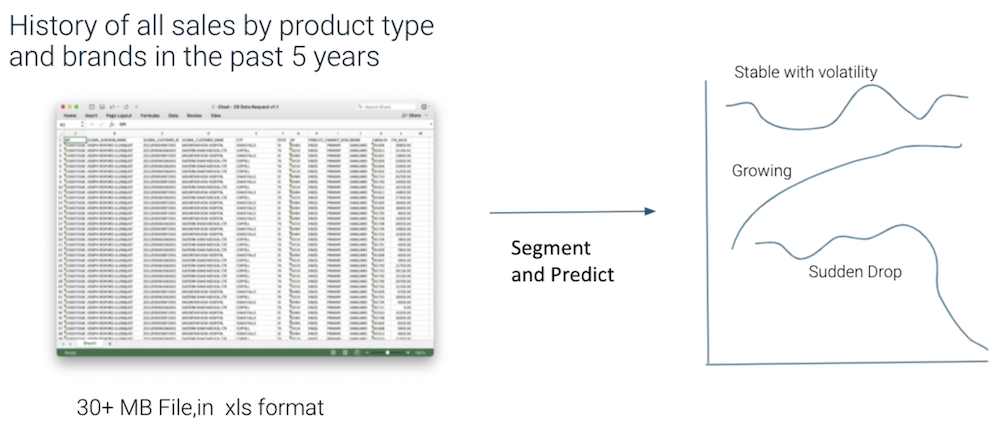
We were provided with 5 years of data contained in a 30 Mb file. The goal was to find answers to the above 3 questions.
The project started with a brainstorming sprint to determine how many ways we could analyze the data and then pare down to the approaches that would work best.
The following is a list of concepts from the original ideation session:
Sample Concepts: Product mix and revenue. Product revenue timelines. Customer definition models. Revenue/trends of each product line by each type of customer. Separating short time customers vs long term, and how much revenue in each category. Labels: New customers (and rate of revenue gain), Lost customer (and rate of revenue loss), Retained Customer. Customer characteristics: mean sales, variance, revenue in each year. Normalized Revenue in each year? Greater weight on small customers who buy for identifying patterns. Forecasting with ARIMA, Sarimax, autocorrelation. Product mix and trends by geography. Product mix and trends by work location. Echelon testing per customer category.
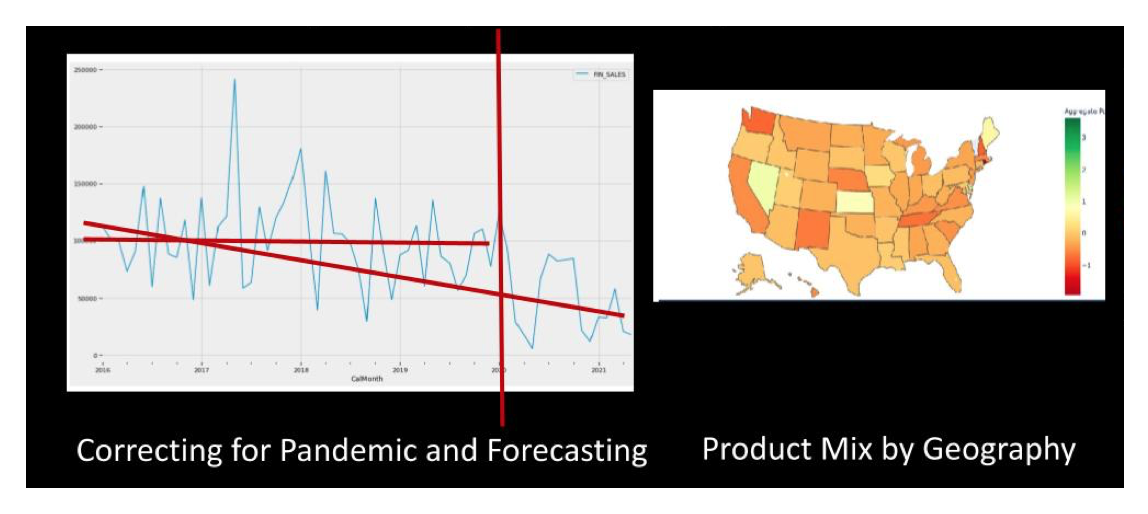
Method #1: Build 2 sets of predictions and then calculate the “Pandemic Effect”
One of them is based on data that ends by January 2020. The other IS based on data that ends with current sales. Then we used the predicted value based on non-pandemic data to compare with actual values.
Pandemic Effect = [Predicted2021(from_pre2020) - Actual2021] / Predicted2021(from_pre2020)]
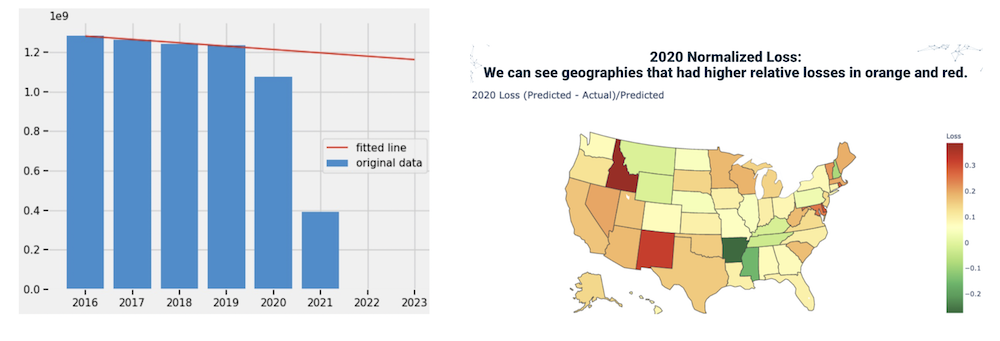
It is possible to calculate this number by market, product, and/or by region. Pandemic effect is a percentage) gain or loss due to the pandemic. It is an interesting quantity because it allows long term pre-pandemic trends to be considered separately from the drop in pandemic sales. The curvature of the deviation can also be used to help predict the time to return to normal and/or the possibility of a new normal.
Method #2: Defining past customers as new/growing, long term, and lost using logic.
While it is common to jump to machine learning and predictions, the first goal is to understand the customer types. We used “logic” as in “if - then statements” to classify past customers in the window of time prior to the pandemic. For example, customers with no orders in the first 6 months were considered new customers. Customers with no orders in the last few months of the data set were marked as lost customers. Customers who had orders from beginning to end were marked as long - term customers. By marking and then viewing and characterizing these by logical segments, we were able to learn what is common and different with growing, sustaining, and lost customers. Note that a 4th category of “short-term customers” does exist where they were new/growing and then later lost customers.
Using a hybrid approach of logical rules and statistics is helpful to pre-classify and train for more complex questions.
Method #3: Segmenting the “Pandemic Effect” by Customer Size to Learn Which types of Customers have been most affected
The “Pandemic Effect” percentage is a useful predictive number because it allows us to see the gap between pre and post pandemic effects on sales volume. This analysis can be even more helpful if we segment the customers by size. To do this, we ordered the customer list from largest to smallest total volume of sales and then divided it into 10 equal sales volume segments. Then by calculating the “pandemic effect” on each, we are able to see which customer segments have the largest gap from predicted values and therefore which customers require more communication. This is particularly important because smaller customers must be engaged in different ways then larger customers. This analysis may lead to changes in engagement strategy.
Method #4: Prediction of Customers in Danger of Loss
Using customer data trained and classified by logical rules about growing, long-term, and lost customers, we are able to use standard ML classification to determine the customers most likely to remain good customers. This might sound backwards, but it is possible to get relatively high confidence intervals on those who are solid customers. The remaining set might stay or be lost without intervention. We found that straight forward classifiers like KNN worked fairly well with columns like past sales quantized by year and the features/labels generated from our logic -based rules.
The pandemic effect has introduced anomalies into data sets that we typically use. When it comes to customer forecasting and predictions, we can no longer rely on past models modification. The approaches highlighted here include the “Pandemic Effect” predictor, segmentation by rules, segmentation by customer type, and prediction of customer retention based on these newly defined features. These techniques are modifications that we found most effective to make revenue predictions within just a few weeks.